Discuss your analysis
OINDP · NASAL SUSPENSION Q3 ANALYSIS
Result: 2,671 Raman-confirmed API particles were measured, with a median circular-equivalent diameter (D50) of 2.35 µm.
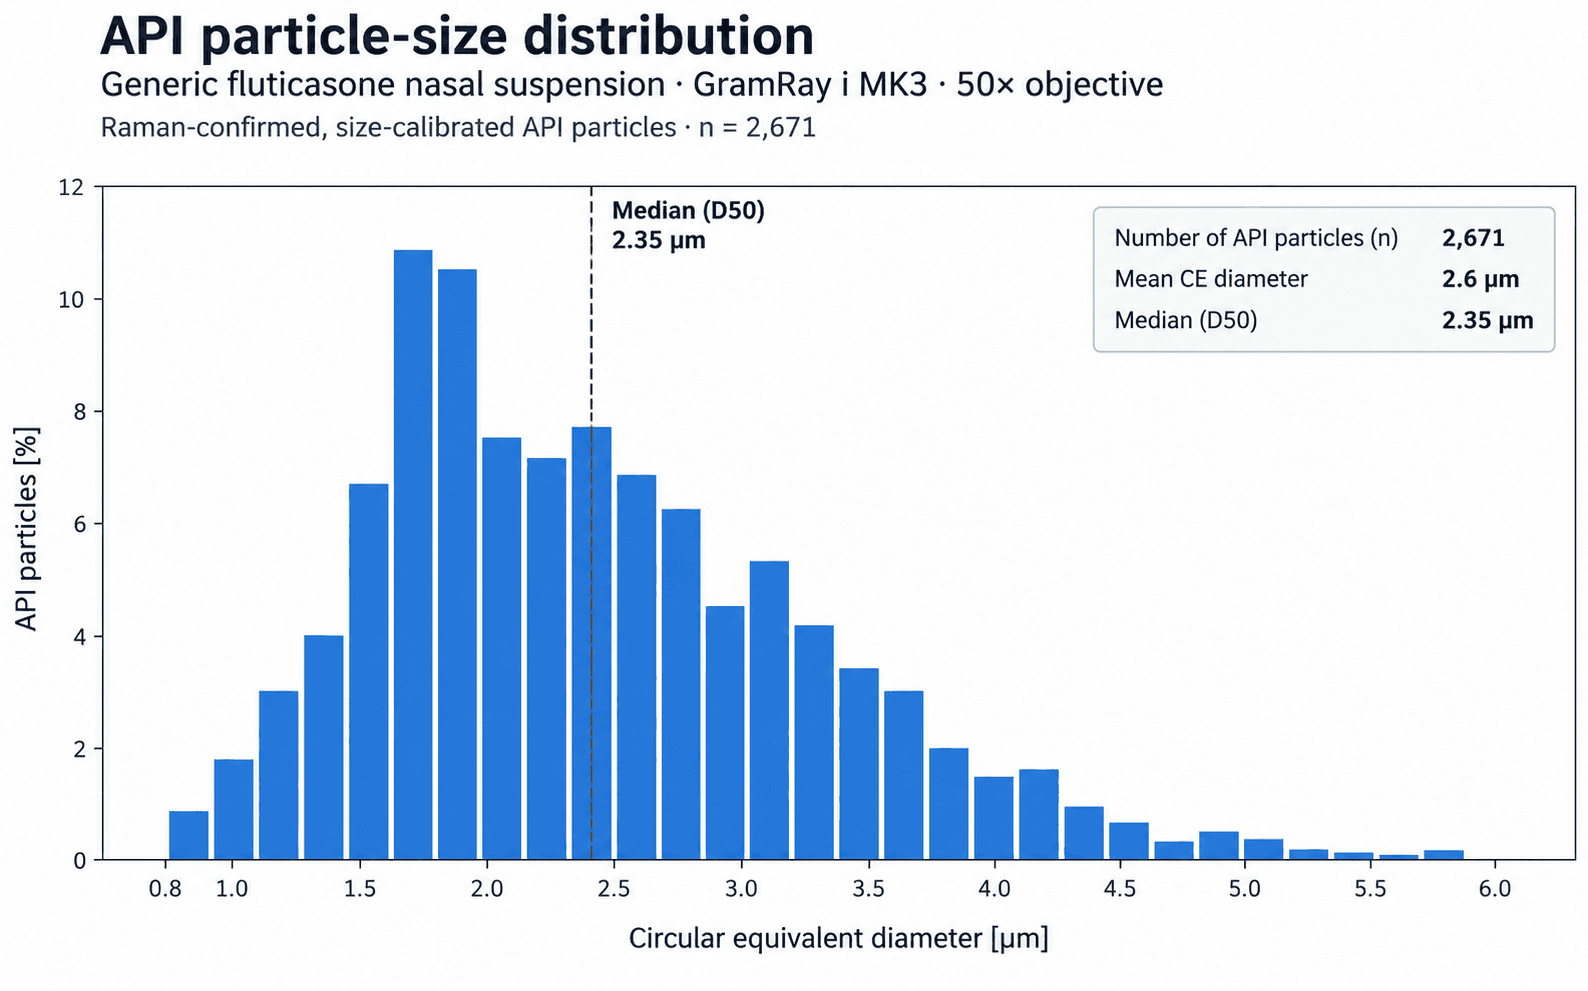
Authentic GramRay i MK3 result: Raman-confirmed, size-calibrated API particles from a generic fluticasone nasal suspension.
THE ANALYTICAL PROBLEM
Simple size, circularity, solidity or elongation rules assume what an API or composite particle should look like. These assumptions can introduce selection bias. DeepMorph offers image-model-based candidate selection before targeted Raman confirmation.

Authentic example: conventional morphology targeting → DeepMorph candidate recovery → 2D Raman confirmation of an API–excipient composite particle.
DEEPMORPH WORKFLOW
01
Optical population screening
Large particle populations are imaged rapidly.
02
DeepMorph classification
Optical images are evaluated directly rather than only through rigid shape thresholds.
03
Candidate enrichment
Potential API–excipient composite particles are selected from the full population.
04
Targeted 2D Raman verification
Full Raman mapping is applied to the selected candidate population.
05
Separate outputs
Free API contributes to the PSD; Raman-confirmed composites are quantified as AECP events.
MODEL VALIDATION · HELD-OUT DATASET
>30,000
fully 2D Raman-mapped particles
95.0%
particle-level classification accuracy
94.9%
AECP positive predictive value · 5.1% false discovery rate
DeepMorph was trained and evaluated against Raman-derived particle-level ground truth. More than 30,000 segmented entities were fully characterized by 2D spatial Raman mapping, generating several million spectra. Performance on the held-out validation dataset reached 95.0% overall particle-level classification accuracy.
Mapping used 1.0 µm spatial sampling and 500 ms spectral integration on the GramRay i MK3 platform with 532 nm excitation, 25 mW incident laser power and a 50× objective.
ROUTINE APPLICATION · NASAL SUSPENSION
25,140
Optically screened
25,140
DeepMorph evaluated
550
Selected for full 2D Raman verification · approximately 2.2%
522
Raman-confirmed AECP events

Illustrative field from a generic fluticasone nasal suspension: green bounding boxes mark Raman-confirmed API particles in a 200 µm × 200 µm field of view.
REFERENCE VS GENERIC Q3 COMPARISON
Result: the Reference and Generic examples had free-API D50 values of 3.22 and 3.18 µm, while Raman-confirmed AECP prevalence was 1.71% and 2.08%, respectively.
Reference nasal suspension
Total population screened: 26,450
Free API PSD · D50 3.22 µm · D90 6.81 µm
452 Raman-confirmed AECP events · 1.71% prevalence
Generic nasal suspension
Total population screened: 25,140
Free API PSD · D50 3.18 µm · D90 6.89 µm
522 Raman-confirmed AECP events · 2.08% prevalence
These results provide a comparative view of free-API particle-size distributions and AECP prevalence. They support assessment of Q3 microstructural equivalence; they are not, by themselves, proof of formal statistical equivalence.
Ingredient-specific PSD
Raman-confirmed free API size distribution.
Composite-particle prevalence
Independent measurement of API–excipient composite events.
Traceable chemical verification
Selected structures are verified by spatial Raman mapping rather than inferred from morphology alone.
Together, these measurements provide particle-resolved evidence that can support Q3 microstructural comparison of test and reference nasal suspensions.
REGULATORY CONTEXT
Particle-resolved evidence supports an appropriate product-specific comparability strategy. SizeID.bio works with your team to define populations, references and interpretation within the wider analytical program.
Typical comparative program
A complete comparative Test-vs.-Reference program can typically be executed and reviewed in approximately 6–12 weeks, depending on method readiness, batch design and replicate count.
The current nasal-spray workflow can generate up to approximately 3,000 Raman-confirmed API particles per measurement. Achievable depth depends on the formulation and study scope.
Comprehensive comparative programs may encompass approximately 100–150 automated measurements, including method development, pre-validation, controls and replicated Test/Reference analysis.
Typical planning basis: 10 Test / Reference batches, 3+ replicates, method development / pre-validation, and approximately 100–150 automated measurements.
Current measurement duration for this nasal-spray workflow is approximately 6 hours.
Reviewed comparative dataset suitable for integration into the broader ANDA / development evidence package. MDRS contributes to the wider evidence program; it does not alone establish bioequivalence.
Discuss the formulation, reference product, particle population and analytical question with SizeID.bio. We can define a study around ingredient-specific particle size, complex agglomerates and targeted Raman verification.
Discuss your OINDP study