SizeID.bio
What brings you here?

Foreign Particle Investigation
Found particles? Let’s identify them and investigate their source.
From visible contamination to subvisible particle populations, identify materials, characterize particle distributions and investigate potential contamination sources.
Investigate unknown particles →

Parenteral & Combination Drug Products
Unexpected particle counts? Find out what is behind them.
Complement subvisible particle counting with chemical identification and material-specific population analysis to investigate OOT/OOS findings and changes in pharmaceutical components or processes.
USP <788> · Ph. Eur. 2.9.19
Understand your particle counts →

OINDP & MDRS
Comparing formulations? Look beyond particle size alone.
Characterize Raman-confirmed API particles, size distributions and morphology to support test/reference formulation comparisons.
Explore formulation comparability →
Raman identification complements, but does not replace, compendial light obscuration (LO) or microscopic particle-count testing.
Your particle investigation is our starting point.
Every investigation starts with a different question. We listen first — to understand your product, process, previous findings and the decision your team needs to make.
Our specialists combine decades of experience in visible and subvisible particle characterization with proprietary analytical technology and AI-assisted methods.
Together, we define an analytical approach tailored to your samples, whether you need contamination identification, advanced troubleshooting, method development or comparative particle characterization.
Personal communication. Sound analytical judgment. Responsive execution.
Explore analytical services →
More than particle counts. Evidence that helps you investigate.

Identify
Determine the chemical identity of individual particles using Raman spectroscopy.

Quantify
Characterize particle counts, sizes and material-specific populations.

Compare
Examine differences between samples, batches, components and reference formulations.

Investigate
Combine particle characteristics, reference materials and analytical context to support probable-source investigations.
Automated imaging, morphology and AI-assisted classification support the analytical workflow. Material identification and probable-source interpretation depend on suitable measurements, references and investigation context.
Explore automated particle Raman technology →
Discuss ISO 8871-3 stopper-rinse investigation context →
From a particle image to chemical identity
A particle image shows appearance. Its measured Raman spectrum provides a chemical fingerprint that can be compared with reference materials. In this original example, particle 11292 was identified as polypropylene. Material identity helps focus the investigation; it does not by itself establish the contamination source.
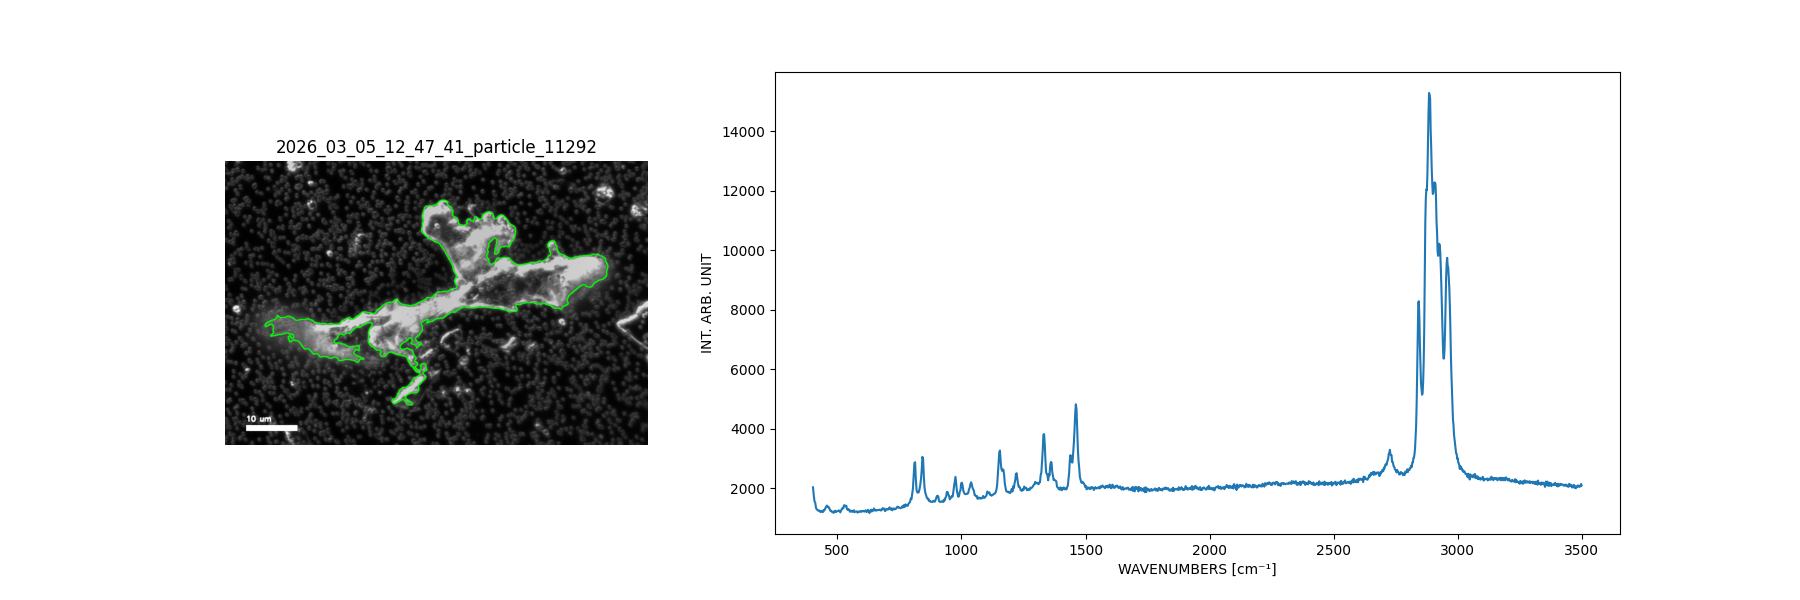
Particle 11292 · Original particle micrograph and associated measured Raman spectrum from the H01 dataset. Raman identification: polypropylene.
View the original image and Raman spectrum at full resolution →
Explore foreign particle identification →
From your question to reviewed findings
We work with you to shape the analytical plan around your question and samples. These steps adapt to the needs of each project.
01
Listen & understand
Discuss the product, samples, existing findings and investigation objectives.
02
Plan the analysis
Agree on suitable methods, sample handling, controls and references.
03
Analyze & interpret
Apply imaging, Raman spectroscopy and relevant particle-population analysis.
04
Report & discuss
Provide documented findings and review their significance with the customer.
Discuss your project →
Reliable analysis. Documented quality.
Documented analytical procedures connect traceable particle images, spectra and results with technical and quality review. Customer audit opportunities support discussion of the documentation relevant to your investigation.
ISO 9001:2015 quality management: MIBIC GmbH & Co. KG, certificate 31617908 QM15, issued by DQS GmbH. The supplied certificate is valid from 23 October 2023 to 22 October 2026 and covers spectroscopic equipment and accessories, method development and feasibility/case studies.
Explore our quality standards →
Let’s discuss your particle investigation.
Tell us about your samples, your analytical challenge and the questions you need to answer. We’ll help you identify a practical next step.
Contact our specialists →